More on AL vs NS relief appearances
Posted by Andy on January 18, 2010
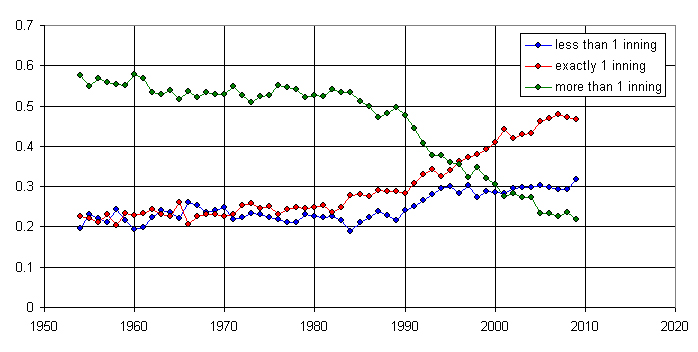
Recently I posted the breakdown of AL non-save-situational relief appearances into fraction that were less than one inning, exactly one inning, or more than one inning. As a reminder, here is the plot:
As we discussed in the previous post, 1973 saw a big change in the distribution of relief appearances thanks to the introduction of the designated hitter. Since that year, appearances of more than one inning have steadily declined while shorter appearances have become more frequent, with appearances of exactly one inning rising sharply.
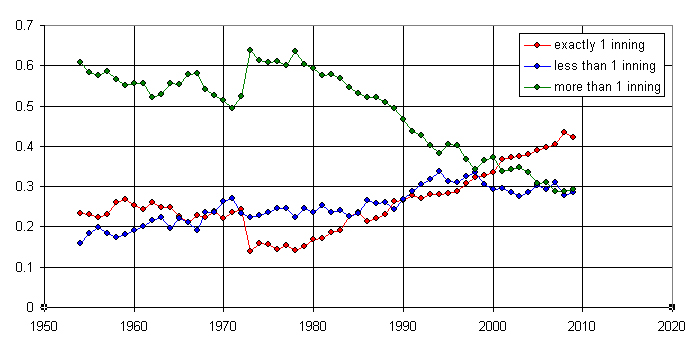
Now here is the exact same plot, only for the National League.
 On the surface, the plots look very similar, and in fact they are. Here are my key observations:
- Obviously, the blips in 1973 are missing from the NL graph. There was no rules change around the DH in the NL and thus no sudden changes in how pitchers were used between the 1972 and 1973 seasons.
- There are numerous year-to-year swings that are different on the NL graph as opposed to the AL graph. For example, appearances of exactly one inning dropped pretty sharply in the NL from 1965 to 1966, going from about 26% of all appearances in 1965 to about 21% in 1966. The AL graph shows a drop in that same year as just about 1% and it went right back up in 1967. There are lots of other examples and my guess is that they are down to one or two specific teams changing their relief pitcher usage models for a year, perhaps due to an injury.
- The data for appearances of less than one inning are virtually identical for the two leagues. The fractional values have been within 5 percentage points of each other for most seasons and the introduction of the DH in 1973 did not cause a sudden change to the AL numbers that year. Both values have hovered right around 30% for the last several seasons.
- Appearances of more than one inning have behaved very similarly, except for the 1973 'glitch' in the AL. In the mid 1970's the AL averaged about 61% for this stat and it fell off to about 29% in the late 2000's, a drop of 32 percentage points. Comparatively, the in the mid 1970's the NL averaged about 53% and fell off to about 22% in the late 2000's, a drop of 31 percentage points. This suggests that once the DH difference was introduced, changes in how relievers have been used since that time have probably had more to do with pitching philosophy than batting order or pinch-hitting issues.
- The same is true with appearances of exactly one inning. Since 1973, both leagues have seen such appearances increase in frequency by about 25 percentage points.
It's fascinating to me that changes over the last 35 years in both leagues are probably due entirely to how pitchers are developed and used, and yet differences between the leagues remain based on a baseline shift from 1973.
If you have been bored to tears by these posts, I'm happy to tell you that this is the last one I'll be posting on this particular subject. However I will also be posting some graphs on appearances exactly one batter long.


January 18th, 2010 at 5:06 pm
I still don't know why you are leaving out save situations. I know you have that other study that shows a trend with save situations, but I can't wrap my head around what percentage of relief appearances are being displayed above, so I don't know how much of an adjustment keeping/removing save appearances makes. Could you generate plots that include all relief appearances?
Sorry to be difficult. The plots are very cool.
January 18th, 2010 at 9:37 pm
I've found these educational. Some of the posts here are the very definition of trivia, which is alright because they can be interesting, but it's nice to have stuff like this which really enhances our understanding of the game and its history.
January 20th, 2010 at 11:13 pm
Andy,
Sorry to bother you experts with a neophyte's question, but I am trying to put together a graph showing the rise in the average number of relief appearances per game since 1946 for book on baseball that my boss is writing for Stanford University Press, but I have not as of yet found this data published in usable form.
Could you please point me to where I might find such data?
Also, I second DavidRF's request regarding publishing the above graphs with all relief appearances, largely because I am pretty sure that, before the rise of the closer transformed the "save" into the "Save," coming in before an out was recorded in the 6th on the road or the 5th at home was a real "save situation."
Thank you very much.
Mike