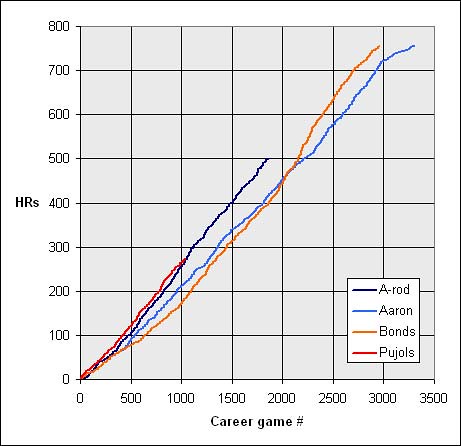
Career home run graphs for Aaron, Bonds, A-rod, and Pujols
Posted by Andy on August 5, 2007
Taking Professor Dave's advice, I have re-done this graph with games played on the x-axis and homers hit on the y-axis. It's not more intuitive. Plus, I made each player's like the same color as his uniform...A-rod is navy, Bonds is orange, Pujols is red, and Aaron is light blue, like those old Atlanta uniforms.
Much comment and analysis after the jump.
Firstly, in case you want to know how this graph was made, I went to the PI game logs for each player (such as Hank Aaron's), selected home runs, and then I copied all the data into a text file which I imported into Excel and organized to make this graph. The advantage of the game log is that it identifies every game that the player played in, skipping over team games in which he did not appear.
So let's analyze each line above:
- Hammerin' Hank Aaron's line, if you look carefully, starts at game number 429 and 66 HRs. That's because all of his games before that came prior to 1957 and are not available in the database. He homered at a fairly constant rate over his career, hitting 200 to 250 homers per 1000 games played. Through most of his career (from game 500 to game 2500) he averaged 0.245 homers per game.
- Barry Bonds, as we have noted before, started fairly slowly, significantly behind Aaron's pace. In the 2035th game of his career on May 12, 2000, Bonds hit his 462nd career HR, tying him with Aaron's pace. (Aaron also had 462 career homers in his own 2035th game.) Bonds took off from there, setting the single-season HR record the following year. As we noted in a previous post, Bonds' HR rate has been much faster in the latter part of his career. From games 0 to 1000, he averaged 0.172 HR per game. For the next 1000, he averaged 0.281 HR per game, and from 2000 games to present (956 games), he's averaged 0.316 HR per game. 1000 games is a fairly large sample and those HR rates are dramatically different. For one thing, he batted lead-off in a lot of those early games, where his job was to get on base, not hit homers.
- A-rod has had a very constant pace for his whole career. He's averaged 0.270 HR per game played, well off of Bonds' peak rate late in his career, but well ahead of Aaron's pace.
- And finally Pujols. Some of his career luster came off earlier this year when his HR pace dropped, but let's not forget what a monster he was over his first 6 seasons, and by the end of this year he'll still likely end up with 35+ HR and an OPS of 1.000. Pujols has played just over 1000 games so far in his career, and he's averaging 0.264 HR per game. Very close indeed to A-rod's pace.
One of the many things that the above graph doesn't show is how much time each player has missed, nor does it show their ages at any point.
Keep in mind the ages these guys where when they started out: Pujols (21), A-rod (20 in his first full season), Bonds (21), Aaron (20). They are all quite young, although there is an edge there for A-rod and Aaron being a year younger.
As I said before, I don't think there is anything at all except injury to prevent A-rod from passing Aaron, and passing Bonds' eventual record as well. It will be interesting to see just how far Bonds goes. If he can get an AL team to pick him up as DH, it's conceivable he might play another 200-300 games and tack on as many as another 100 HR. But given how many games he is already missing on a regular basis, I don't see that as too likely. 800 is probably his maximum.
August 5th, 2007 at 12:40 pm
If you're interested in this, definitely check out Jayson Stark's piece today (link at the bottom), especially the second half about Bill James' Favorite Toy for likelihood of reaching certain career totals. There is no good way of predicting these things, as Stark points out.
http://sports.espn.go.com/mlb/columns/story?columnist=stark_jayson&id=2947658
August 6th, 2007 at 11:10 pm
I'd like to see Kiner and Mathews on the graph. They got off to fast starts. With Career Games on the X-axis, Ted Williams would have an impressive start on the chart too.
August 7th, 2007 at 7:25 am
Kiner's entire career came before 1957, so we won't have complete day-by-day box score info for him. Matthews played 1952-1968 so we can get 2/3rds of his career, but you won't see that early start (just like how we don't have the beginning of Aaron's career.) You're right, though...in his 2nd, 3rd, and 4th seasons, Matthews had 47, 40, and 41 HR (and he had at least 31 in the 6 following seasons.)
Of course, keep in mind that with A-rod being the youngest to 500 HR, nobody had a "faster start" than A-rod, at least to the 500 benchmark.